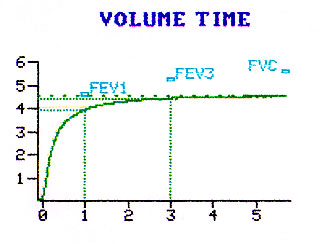
The amount of air that can be blown in the first second in the FVC maneuver.
Note this amount in volume time graph..

Print version of Knowledge bytes used in this lesson.
Close the window to return to the lesson after printing.
Spirometry
Forced Vital capacity (FVC)
Total amount of air that can be blown out after a maximal deep breath, as fast
as you can.
Note this amount in volume time graph.
Best of 3 attempts is taken.
The normal range is 80-120% predicted.
Forced Expired Volume in One second (FEV1)
The amount of air that can be blown in the first second in the FVC maneuver.
|
|
| The normal range for FEV1 is 80-120% predicted |
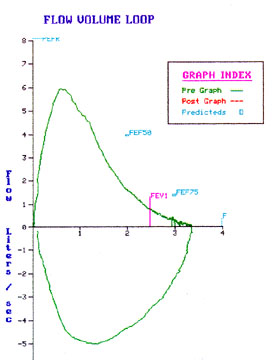
FEV1/FVC
FEV1 volume divided by FVC expressed as percent.
I am going to create some confusion. There are two ways of judging the normal range.
FEF25-75
Forced expiratory flow rate between 25 to 75% of FVC.
This used to be called maximal mid expiratory flow rate.
We are looking at the flow rate of the mid portion of FVC. Note this in the volume time
graph.
The normal range is 75-125%.
This measure is thought to represent early evidence for obstruction.
| Peak expiratory flow rate. Note the location of PEFR in the flow volume loop. This graph represents flow rate against lung volume. Peak flow occurs early during forced expiration. Normal range is 80-100%. |
 |
| Forced expiratory time(FET) Note the time taken to complete FVC in the volume time graph.
|
|
| PIFR Note the peak inspiratory flow in the flow volume loop graph. Note the difference in configuration of inspiratory and expiratory limbs of flow volume loop. |
|
| FIVC This measure is obtained while performing flow volume loop. I don't use this value much in interpretaion because we never take enough time to seriously perform inspiratory effort. |
|
 |
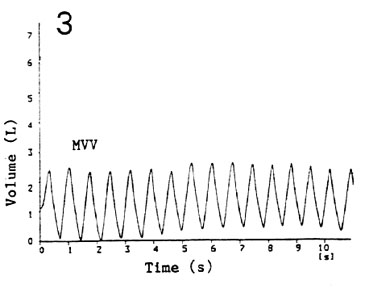
| Maximal voluntary ventilation (MVV) This is the amount of air that can be moved in and out as fast as you can in one minute. We ask the patient to breath as deep and as fast as possible for 10 seconds and
express it for a minute. Click to see how it is performed (not yet). |
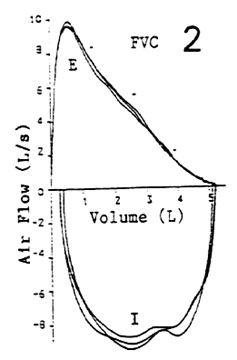
Flow Volume Loop
Evaluate the loop for
|
 |
|
 |
| TV IC ERV SVC |
 |
Maximal Voluntary Ventilation
| Note: Rate Volume of breaths |
 |
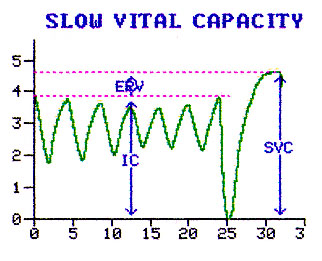
Slow Vital capacity (SVC)
Total amount of air that can be blown out after a maximal deep breath.
SVC is done leisurely and you can actually take the best inspiratory capacity from one curve and add to the best ERV from another.
FVC is done with the patient expiring as fast as he can.
The normal range is 80-120% predicted.
| TV IC ERV SVC |
|
| Lung Volumes IC: Inspiratory capacity |
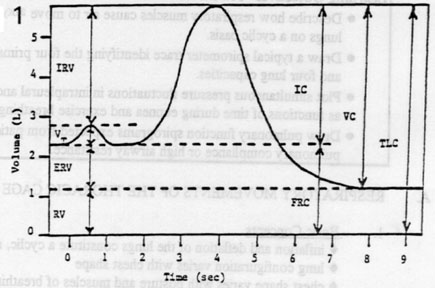 |
| The normal range for lung volumes are 80-120% predicted. |
Volume Vs Capacity
Total Lung Capacity (TLC)
Total lung capacity can be measured by
In routine PFT interpretation we will be primarily be evaluating TLC by the first three methods.
Plethysmograhy: Measures Slow spaces (Blebs)
Helium dilution: May underestimate slow spaces.
Single breath: We will consider it under diffusion measurement.
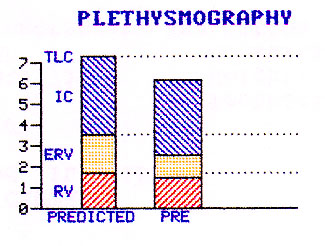
| Lung Compartments Compare predicted with
observed |
 |
Normal PFT values depend on many variables like height, weight, sex etc. A nomogram is developed using a large number of normal people and the value will be compared to that obtained from predicted based on his/her height weight etc. A normal range is 2 standard deviation from mean and it varies from test to test. In general it is 20%. Hence if you are looking at a first PFT you can consider a value as abnormal only if it is outside 2 standard deviation( 80-120%). Hence I always start by looking at percent predicted value to make a decision whether it is in normal range or not. Don't worry about the actual observed value (for now).
DLCO UNC Diffusion capacity uncorrected Patient is asked to take a deep breath of air containing known concentration of carbonmonoxide and to hold it for 10 seconds. The terminal (alveolar air) portion of expiration is collected to measure CO concentration. Diffusion capacity is then calculated using a complex formula. |
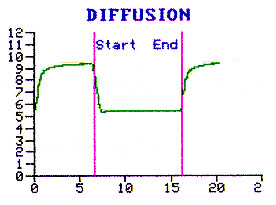 |
| The normal range is 75-125% predicted. |
DLCO CORR
Diffusion capacity corrected
A correction for predicted value is made using patients Hemoglobin.
The normal range is 75-125% predicted.
VA @BTPS and DL/VA
Single breath TLC (VA @BTPS) is measured simultaneously by adding known concentration of Helium to measure alveolar volume exposed to Carbonmonoxide. This alveolar volume is used in expressing diffusion capacity for unit lung volume i.e. DL/VA.
The normal range is 75-125% predicted.
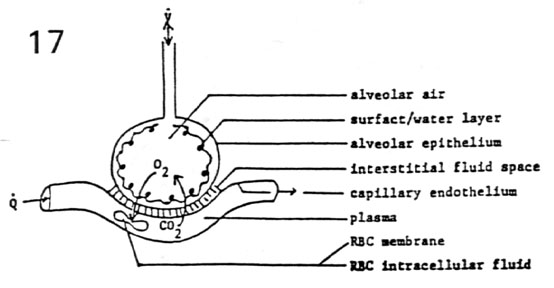
| Factors affecting DLCO Primary purpose of
measuring diffusion capacity is to assessthe barrier for gas transfer at alveolar
capillary membrane.
|
 |
Evaluate the graph for
|
|
|
 |
Evaluate the graph for
|
 |
| TV IC ERV SVC |
 |
| Maximal Voluntary Ventilation Evaluate the graph for Note: |
 |
Evaluate the graph for
|
|
| Lung Compartments Compare predicted with
observed |
 |