Learning Objectives: You should be able to:
- Differentiate between gas partial pressures in the blood
versus gas contents in the blood, illustrating the importance of each.
- Explain the numerous ramifications of the oxyhemoglobin
dissociation curve in physiological terms.
- Describe how oxygen supply and demand are balanced in the
lungs and tissues in various metabolic states of activity.
- Determine why carbon monoxide poisoning is a much more
serious threat to life than anemia in terms other than decreased arterial
oxygen content.
Rhodes & Tanner Text Readings: chapter 21, Pages 391-394.
Partial Pressures and Contents
Oxyhemoglobin Dissociation Curve
Oxygen Supply and Demand
Alterations
in Oxygen Dissociation Curve MainMenu
Partial Pressures and Contents in the Blood
- Basic Principles
- in pulmonary capillaries, gas partial pressures dictate
gas contents
- PAO2 PaO2 CaO2
- PACO2 PaCO2 CaCO2
- in tissue capillaries, gas contents dictate gas partial
pressures
- Gas Partial Pressures in Systemic Arterial and Venous Blood
- PaO2 = 95 mm Hg PvO2 = 40 mm Hg
- PaCO2 = 40 mm Hg PvCO2 = 46 mm Hg
- PaH2O = 47 mm Hg PvH2O = 47 mm Hg
- PaN2 = 578 mm Hg PvN2 = 578 mm Hg
------------------------------------------------------------------
- Patot = 760 mm Hg Pvtot = 711 mm Hg
- Absorption Atelectasis
- consequences of subatmospheric value in Pvtot of -49 mm
Hg
- air trapped within the intrapleural spaces is
normally reabsorbed
- alveoli sealed off by mucous plugs collapse (atelectasis)
- alveolar stability depends upon unit V A/Q ratio and
operating PAO2
- stable alveolus: oxygen supply >> oxygen
uptake (normal V A/Q ratio)
- critical alveolus: oxygen supply = oxygen uptake
(low V A/Q ratio)
- unstable alveolus: oxygen supply << oxygen
uptake (very low V A/Q ratio)
- nitrogen gas in the alveolus normally protects against
atelectasis
- N2 is a buffer gas that can be washed out by 100%
O2 administration
Partial Pressures and Contents
Oxyhemoglobin Dissociation Curve
Oxygen Supply and Demand
Alterations
in Oxygen Dissociation Curve MainMenu
Oxyhemoglobin Dissociation Curve
- Physical Solution of Oxygen
- Henry's Law: O2 dissolved (mL O2/dL) = O2 sol. (mL O2/dL
per mm Hg) * PO2 (mm Hg)
- dissolved O2 is a linear function of PO2
- O2 solubility = slope of line
- O2 solubility in blood is very low, hence dissolved O2
content is very low at normal PO2 = 100 mm Hg
- O2 solubility = 0.003 mL/dL per mm Hg (a constant
independent of prevailing PO2)
- O2 content = 0.3 mL O2/dL (a variable dependent
upon prevailing PO2)
- Oxygen Carriage by Hemoglobin
- characteristics of human hemoglobin
- chromoprotein with average molecular weight around
64,000
- 2à and 2 chains form a tetramer with each chain
having its own heme group
- each heme group consists of a protoporphyrin ring
with a ferrous atom in the center
- O2 binds covalently and reversibly with hemoglobin
contained within red blood cells
- maximum of 4 molecules of oxygen bind to the 4 Fe++
sites
- this is oxygenation since the ferrous atoms are not
oxidized to the ferric state
- O2 cannot bind to oxidized hemoglobin
- hydrogen peroxide oxidizes Fe++ to Fe+++
- oxidized hemoglobin is known as met hemoglobin
- Oxyhemoglobin Dissociation Curve
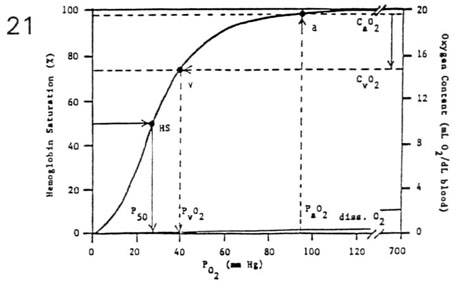
- the amount of O2 carried by hemoglobin is a curvilinear
function of PO2
- sigmoidal curve reflects the four-stage loading of
oxygen
- oxygen loading (lungs) occurs over flat portion of
curve
- oxygen unloading (tissues) occurs over steep
portion of curve
- important relationships
- oxygen capacity (mL O2/dLblood) =
(1.36 mL O2/gram Hb) * (15 gram Hb/dLblood)
- oxygen content (mL O2/dLblood) =
Hb saturation (%) * oxygen capacity (mL O2/dLblood)
- P50 is the PO2 corresponding to 50% saturation of
Hb
(half-saturation point = 27 mm Hg)
- CaO2 - CvO2 represents the total amount of O2
extracted
(mL O2/dLblood) body wide
- total O2 content in the blood computes as the sum of O2
bound to hemoglobin (HbO2) and O2 dissolved
- at PO2 < 333 mm Hg, O2 dissolved can be ignored
(< 1 mL O2/dL is insignificant)
- at PO2 > 333 mm Hg, O2 dissolved cannot be
ignored
(> 1 mL O2/dL is significant)
- Myoglobin Dissociation Curve
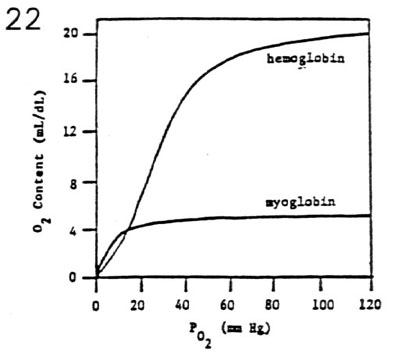
- myoglobin is a muscle protein with oxygen carrying
characteristics
- each myoglobin molecule has one site for
reversible oxygen binding
- hyperbolic curve reflects one-stage loading of
oxygen
- P50 of 5 mm Hg indicates high oxygen affinity
at low PO2 values
- myoglobin provides an important source of O2 for
exercising muscle
Partial Pressures and Contents
Oxyhemoglobin Dissociation Curve
Oxygen Supply and Demand
Alterations
in Oxygen Dissociation Curve MainMenu
Oxygen Supply and Demand
- Basic Concepts
- Fick equation: V O2/Q = CaO2 - CvO2
- O2 demand metabolic rate (V O2)
- O2 supply blood flow (Q )
- magnitude of CaO2 - CvO2 indicates ratio of O2
demand/O2 supply
- (CaO2 - CvO2) due to � O2 demand and/or �
O2 supply
- � (CaO2 - CvO2) due to � O2 demand and/or
� O2 supply
- Krogh cylinder or cone
- Effect of Decreasing Blood Flow for Constant Metabolic Rate
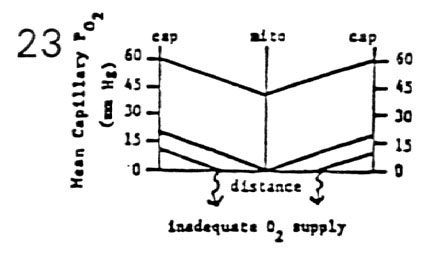
- tissue PO2 falls off linearly as a function of distance
from two supply capillaries
- the deepest tissue has the lowest PO2
- � Q induces a parallel downward shift in PO2 curve
to a critical level
- mitochondria still function at PO2 = 0.5 mm Hg
- �� Q induces a further parallel downward shift
in PO2 curve to an inadequate level
- oxygen is depleted before deepest tissue is reached
due to inadequate O2 supply
- depending upon tissue perfused, anaerobic
metabolism is established or infarct occurs
- Effect of Increasing Metabolic Rate for Constant Blood Flow
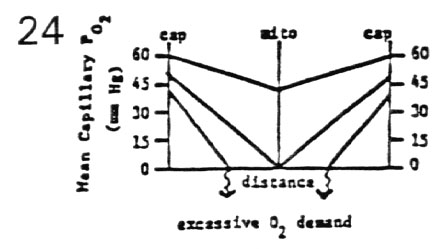
- tissue PO2 falls off linearly as a function of distance
from two supply capillaries
- the deepest tissue has the lowest PO2
- � MR induces a downward shift and steeper slope in
PO2 curve to a critical level
- mitochondria still function at PO2 = 0.5 mm Hg
- �� MR induces a further downward shift and
still steep slope in PO2 curve to an inadequate level
- oxygen is depleted before deepest tissue is reached
due to excessive O2 demand
- depending upon tissue, anaerobic metabolism is
established or an infarct occurs
- Summary
- a critical situation develops when the O2 demand
exceeds O2 supply
- � O2 demand/O2 supply can be met by � O2
supply (� blood flow)
- � O2 demand/O2 supply can be met by � O2
extraction (� CaO2 - CvO2 difference)
- example causes of cardiac infarcts
- occlusion of coronary blood vessels to the
myocardium (inadequate O2 supply)
- aggressive exercise in patient with significant
coronary artery
Partial Pressures and Contents
Oxyhemoglobin Dissociation Curve
Oxygen Supply and Demand
Alterations
in Oxygen Dissociation Curve MainMenu
Alterations in Oxygen Dissociation Curve
- Normal Curve Shifts
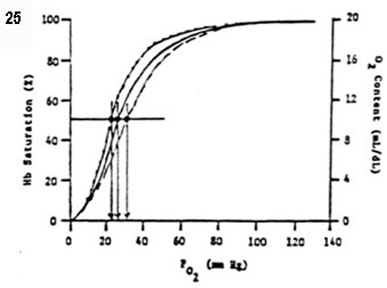
- efficiency of O2 delivery is facilitated with shifts in
the oxyhemoglobin dissociation curve
- right curve shifts (� P50, � O2 affinity)
- � PCO2, � [H+], � temperature, �
2,3-diphosphoglycerate (� 2,3-DPG in chronic hypoxia)
- Bohr effect: � PCO2 shifts the HbO2 curve to
the right
- left curve shifts (� P50, � O2 affinity)
- � PCO2, � [H+], � temperature, �
2,3-diphosphoglycerate (� 2,3-DPG in normoxia)
- Abnormal Curve Shapes
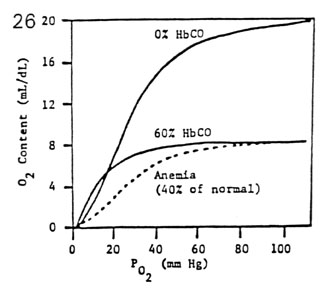
- carbon monoxide favorably competes with oxygen for the
same Fe++ binding sites
- CO has 250 times the affinity for hemoglobin than
O2
- Hb becomes 100% saturated with CO at PCO = 0.6 mm
Hg
- Hb becomes 100% saturated with O2 at PO2 = 600 mm
Hg
- the presence of carboxyhemoglobin distorts the shape of
the oxyhemoglobin curve
- the sigmoidal HbO2 curve becomes hyperbolic (like
myoglobin)
- the HbO2 curve becomes depressed and flattened
(� O2 capacity)
- comparison of 60% HbCO and 40% anemia
- P50 for 60% HbCO = 10 mm Hg (very high O2 affinity)
- P50 for 40% anemia = 27 mm Hg (normal O2 affinity)
- thus 60% HbCO is much more serious than 40% anemia
- dangers of carbon monoxide poisoning


