Learning Objectives: You should be able to:
- List the three forms of carbon dioxide carried by the blood
and how they interact to form the total CO2 dissociation curve.
- Diagram using pertinent chemical reactions how CO2 is
processed by red blood cells traversing tissue and lung capillaries.
- Specify how hemoglobin functions as a hydrogen ion buffer
in venous blood, contrasting principles of reduction versus titration.
- Contrast the changes in blood gas contents and partial
pressures of oxygen and carbon dioxide during hyperventilation and
hypoventilation.
Rhoades & Tanner Text Readings: Chapter 22, Pages 394-400
CO2 Dissociation
C02 Processing
Hydrogen Ion Buffer
Contents and Ventilation
MainMenu
Carbon Dioxide Dissociation Curve
- Three Forms of Carbon Dioxide in the Blood
- physically dissolved CO2 (10%)
- dissolved CO2 increases linearly with increases in
PCO2 (obeys Henry's law)
- CO2 solubility = 0.06 mL CO2/dLblood per mm Hg (20
times higher than O2 solubility)
- dissolved CO2 fraction cannot be neglected
- carbamino compounds (22%)
- CO2 joins reversibly with non-ionized terminal
amino groups (-NH2) of blood borne proteins
- primary sites are 4 terminal amino groups of
hemoglobin which are not ionized at pH = 7.40
- 44 other terminal amino groups of hemoglobin are
ionized and unusable (-NH3+)
- bicarbonate ion formation (68%)
- most CO2 in the blood is transported in the
bicarbonate ion form
- bicarbonate ion is formed from the CO2 hydration
reaction accelerated by carbonic anhydrase: CO2 + H2O H2CO3 H+ +
HCO3-
- red blood cells are crucial for production of HCO3-
from CO2 because of the presence of carbonic anhydrase
- Total CO2 Dissociation Curve
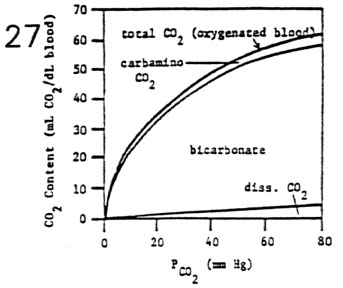
- total CO2 content depends on the summation of the three
CO2 components
- total CO2 content in blood is a hyperbolic function of
PCO2
- Shifts in the CO2 Dissociation Curve
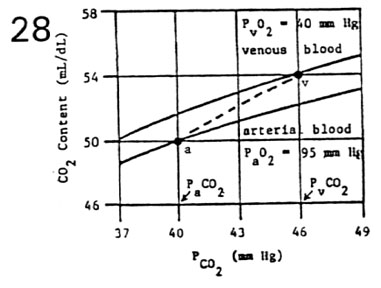
- oxygen shifts the carbon dioxide dissociation curve to
the right (Haldane effect)
- presence of O2 decreases the affinity of hemoglobin
for CO2
- at PaO2 = 95 mm Hg, CO2 curve is shifted down and
to the right (lower curve)
- at PvO2 = 40 mm Hg, CO2 curve is shifted up and to
the left (upper curve)
- total CO2 content in the blood must be read from proper
curve
- at PaCO2 = 40 mm Hg; CaCO2 = 50 mL CO2/dLarterial
blood (point a)
- at PvCO2 = 46 mm Hg; CvCO2 = 54 mL CO2/dLvenous
blood (point v)
- concurrent changes in PO2 and PCO2 form a physiological
dissociation curve (dashed line)
- in the tissues, CO2 content moves up from point a
to point v
low PO2 in the tissues facilitates CO2 loading (reverse Haldane
effect)
high PCO2 in the tissues facilitates O2 unloading (Bohr effect)
- in the lungs, CO2 content moves down from point v
to point a
high PO2 in the lungs facilitates CO2 unloading (Haldane effect)
low PCO2 in the lungs facilitates O2 loading (reverse Bohr effect)
CO2 Dissociation
C02 Processing
Hydrogen Ion Buffer
Contents and Ventilation
MainMenu
C02 Processing by Red Blood Cells
- Carbon Dioxide Reactions in the Blood
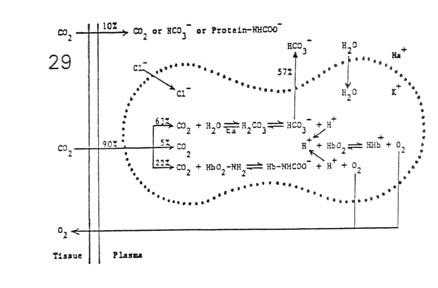
- plasma reactions
- 10% CO2 processing
- lack of carbonic anhydrase
- red blood cells
- 90% CO2 processing
- presence of carbonic anhydrase
- Gradients Established Across the Red Blood Cell Membrane
- diffusion gradient
- CO2 is produced by tissue metabolism
- CO2 moves down its partial pressure gradient from
tissue space to capillary blood
- concentration gradient
- rapid hydration of CO2 produces a high
concentration of HCO3- within RBCs
- HCO3- diffuses out of RBCs down its concentration
gradient
- electrical gradient
- HCO3- movement builds up a net positive charge
within RBCs
- H+ cannot move across membrane (cation barrier)
- Cl- from the plasma moves into RBCs down its
electrical charge gradient
- a Donnan equilibrium is established between HCO3-
and Cl- across RBC membrane
- pH gradient
- not entirely buffered, H+ ions accumulate within
RBCs
- increase in intracellular [H+] leads to a fall in
pH below that of plasma
- osmotic gradient
- summed reactions leads to increased RBC osmolarity
- water moves into RBCs down its osmotic gradient
- RBCs swell on the venous side of the circulation
- diffusion gradient
- partial intracellular buffering of H+ drives O2
from hemoglobin (Bohr effect)
- O2 moves down its partial pressure gradient from
capillary blood to tissue space
CO2 Dissociation
C02 Processing
Hydrogen Ion Buffer
Contents and Ventilation
MainMenu
Hemoglobin as a Hydrogen Ion Buffer
- pH Gradient Across RBC Membrane and Respiratory Quotient
- respiratory quotient (RQ) = mmol CO2 produced/mmol O2
consumed (in tissues)
- respiratory gas exchange ratio (R) = mmol CO2 exhaled/mmol
O2 inhaled (in lungs)
- RQ = R in steady state (ventilation matched to
metabolic demands)
| Fuel |
RQ |
mmol H+ |
pH RBC |
Ph ven |
pH art |
| fats |
0.7 |
0.7 |
7.40 |
7.40 |
7.40 |
| proteins |
0.8 |
0.8 |
7.25 |
7.37 |
7.40 |
| carbohydrates |
1.0 |
1.0 |
7.10 |
7.34 |
7.40 |
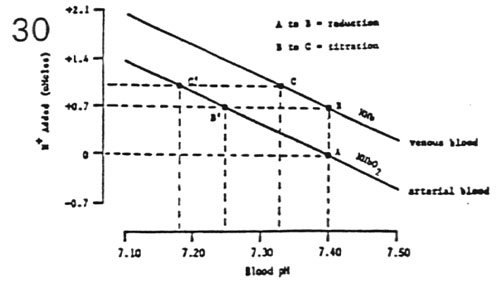
- Titration Curves of
Oxygenated and Deoxygenated Blood (Fig. 30)
- HHB in venous blood is a weaker acid (higher affinity
for H+)
- HHBO2 in arterial blood is a stronger acid (lower
affinity for H+)
- hemoglobin reduction pathway (point A to B)
- for RQ = 0.7, H+ produced perfectly buffered
without fall in pH
- hemoglobin titration pathway (point B to C)
- for RQ > 0.7, H+ produced partially buffered
with fall in pH
- slope of tritation curve depends directly upon
hemoglobin concentration
CO2 Dissociation
C02 Processing
Hydrogen Ion Buffer
Contents and Ventilation
MainMenu
Blood Gas Contents and Ventilation
- Superimposition of Dissociation Curves
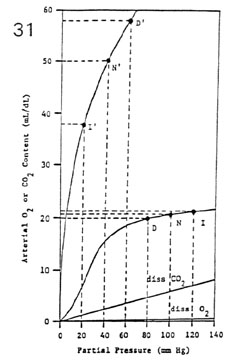
- points N and N': normal operating points during eupnea
- points I and I': shifted points during increased
ventilation (hyperventilation)
- points D and D': shifted points during decreased
ventilation (hypoventilation)
- Hyperventilation and Hypoventilation Maneuvers (Fig. 31)
- changes in
 A cause large changes in PaO2 and PaCO2
- large changes in PaO2 result in small changes in CaO2
(flatness of O2 curve)
- large changes in PaCO2 result in large
changes in CaCO2 (steepness of CO2 curve)
- Significance
- it is possible to effect changes in blood CO2 levels
without jeopardizing oxygen content of the blood
- this is important for acid base regulation in health
and disease
CO2 Dissociation
C02 Processing
Hydrogen Ion Buffer
Contents and Ventilation
MainMenu


