Learning Objectives: You should be able to:
- Describe the importance of ventilation/perfusion matching
at the alveolar level in maintaining proper levels of systemic arterial
blood gases.
- Explain how ventilation/perfusion matching is
physiologically achieved in gravity fields operating on fluids (air/blood)
of such different mass.
- Generate an alveolar PO2-PCO2 diagram that identifies the
three alveolar types, showing the continuum of ventilation/perfusion ratios.
- Identify in vivo pulmonary reflexes that help to correct
for vascular shunts or airway obstructions causing ventilation/perfusion
disturbances.
Rhodes & Tanner Text Readings: Chapter 20, Pages 371-385.
Ventilation/Perfusion Match
Alveolar PO2-PCO2 Diagram
Compensations for V/Q Mismatch
MainMenu
Concept of Ventilation/Perfusion Matching
- Introductory Statements
- ventilation/perfusion inequality is the most common
clinical cause of arterial hypoxemia
- arterial hypoxia (� PaO2) leads directly to
arterial hypoxemia (� CaO2)
- Important Concepts
- ideally, ventilation and perfusion must be exactly
matched
- ventilation must be distributed to perfused areas
- perfusion must be distributed to ventilated areas
- the ratio of ventilation to perfusion (V A/Q ) is the
critical factor governing gas exchange
- regions of high ventilation should have high blood
flows (base of lung)
- regions of low ventilation should have low blood
flows (apex of lung)
- one lung is represented by many regional V A/Q ratios,
not a single V A/Q value
- for V A= 6 L/min and Q = 6 L/min, it is
inappropriate to calculate: V A/Q = 1 Lair/Lblood
- by coincidence, regional V A/Q ÷ 1.0 represents an
ideal match between V A and Q
- inadequate gas exchange occurs when regional V A/Q
<< 1 or V A/Q >> 1
Ventilation/Perfusion Match
Alveolar PO2-PCO2 Diagram
Compensations for V/Q Mismatch
MainMenu
Derivation of the Alveolar P02-PCO2 Diagram
- Regional Variations in Ventilation, Perfusion ad Vent/Perf
Ratio (Fig. 13)
- base of lung: high V A, higher Q , low V A/Q < 1
(wasted perfusion)
- apex of lung: low V A, lower Q , high V A/Q > 1
(wasted ventilation)
- middle of lung: moderate V A, moderate Q , ideal V A/Q
= 1
- Regional Variations in Alveolar Gas Tensions
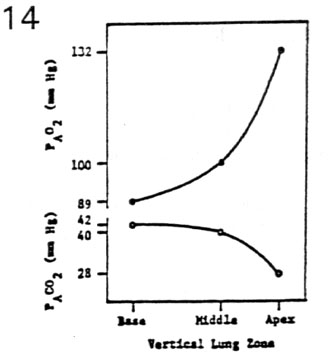
- base of lung: low PAO2 & high PACO2 due to low V
A/Q < 1
- apex of lung: high PAO2 & low PACO2 due to high V
A/Q > 1
- middle of lung: average PAO2 & average PACO2 due to
ideal V A/Q = 1
- Alveolar PAO2-PACO2 Diagram
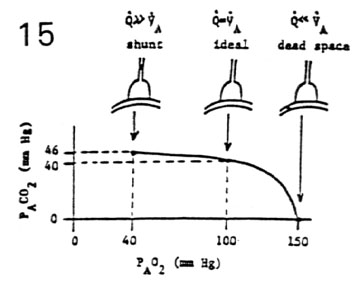
- shunt alveolar unit: V A/Q = 0, PAO2 = 40 mm Hg, PACO2
= 46 mm Hg
- Q >> V A (wasted perfusion)
- dead space alveolar unit: V A/Q = infinity, PAO2 = 150
mm Hg, PACO2 = 0 mm Hg
- Q << V A (wasted ventilation)
- ideal alveolar unit: V A/Q = 1, PAO2 = 100 mm Hg, PACO2
= 40 mm Hg
- Q = V A (idealized matching)
- Continuum of Ventilation/Perfusion Ratios < Ratios
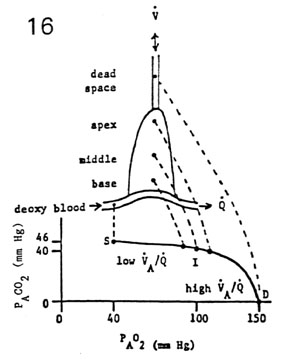
- the alveolar PO2-PCO2 diagram represents a continuum of
V A/Q ratios
- in the normal lung, regional V A/Q ratios range from ÷
0.5 to ÷ 5
- basal alveoli with lower ratios tend toward shunt
(V A/Q ÷ 0.5)
- apical alveoli with higher ratios tend toward dead
space
(V A/Q ÷ 5)
- basal alveoli with intermediate ratios are more
idealized
(V A/Q ÷ 1)
- alveolar dead space (÷10 mL) is attributed to all
alveoli with
- functional pulmonary vascular shunts are attributed to
all alveoli with
Ventilation/Perfusion Match
Alveolar PO2-PCO2 Diagram
Compensations for V/Q Mismatch
MainMenu
Compensations for Ventilation/Perfusion Mismatching
- Hypocapnic Bronchoconstriction
- regional abnormality: � V A/Q (wasted ventilation)
- regional effect: � PACO2 (alveolar hypocapnia)
- reflex response: � Rairway (bronchoconstriction)
- regional result: � V A and � V A/Q
(compensation)
- Hypoxic Vasoconstriction
- regional abnormality: � V A/Q (wasted perfusion)
- regional effect: � PAO2 (alveolar hypoxia)
- reflex response: � Rpul vasc (vasoconstriction)
- regional result: � Q and � V A/Q (compensation)
Ventilation/Perfusion Match
Alveolar PO2-PCO2 Diagram
Compensations for V/Q Mismatch
MainMenu